Wine tasting notes – you couldn’t make them up… could you?

Wine tasting notes and reviews are usually an exercise in self indulgence, in more ways than one. Most are completely unrelated to how you’ll actually enjoy the wine – they’re more about making the reviewer look good. And that’s important, because if people don’t think the reviewer has some special, rarefied insight into wine, then no one will care what they say, and they’ll stop being sent free wine and being invited to wine tasting events.

Take Nick Stock’s review of Clonakilla’s top notch 2015 Shiraz Viognier:

The aromatic spectrum is vast, from fine musky florals to white pepper and almost every imaginable spice, then an incredibly exuberant explosion of fruit, boysenberry, raspberry, cherries of every shade, and plums from red to blue and purple; it is full of life.

The palate has an incredibly deep draw, total palate saturation of ripe red cherry, raspberry and red plum flavor, chocolate and a dusting of white pepper. The tannins radiate light and energy, bright from start to finish. Perfectly ripe, seamlessly balanced and actually very approachable.

Drink it now, but there’s plenty to come in time; this will be best from 2022.

The wine may or may not actually be full of life, but I certainly know what the review is full of. Every shade of cherry! An impressive palate indeed.

It makes you wonder how reviewers actually come up with their reviews. I suppose more pithy and factual reviews would quickly become self-similar. But perhaps there’s a market for a tool to help reviewers hone their prose.

Continue reading

NDC Sydney talk

In August this year, I gave a talk at NDC Sydney on Real-time Twitter Analysis with Reactive Extensions. NDC is the Norway Developers Conference, so it’s a natural progression for them to come to Sydney. This was their first time down under, but they’ve already announced they’ll be back in August 2017.

It was a three day conference with over 100 speakers, some international and some local. That’s a lot of speakers, and it translates into 7 parallel tracks, or 7 concurrent talks.

Full talk video and code online

The video of my talk is on NDC’s vimeo channel, and the code and data driving the visualizations in the talk is on github. The repository is fairly large because the data files total a couple of hundred megabytes.

I’ve written a few articles covering parts of the material in the talk and discussing the code approach:

Continue reading

Tracking Twitter Discussion Topics in Real Time with Reactive Extensions

During my recent NDC Sydney talk on real-time Twitter analysis with Reactive Extensions, I talked about the approach I used to track current discussion topics as they changed over time. This is similar to Twitter’s trending topics, but changing more dynamically.

The source data came from Twitter traffic during two episodes of the ABC’s Q&A show in the lead up to Australia’s 2016 federal election. Each of the candidates for Prime Minister – incumbent Malcolm Turnbull and opposition leader Bill Shorten appeared as a solo guest to face questions from the audience.

I wanted a live view of the current topics of discussion as the show progressed, to get a feel for which topics the Twitter audience was responding to.

Continue reading

Detecting spikes in time series with Reactive Extensions

I recently spoke at NDC Sydney, which was a great experience. My talk was on Real-Time Twitter Analysis with Reactive Extensions. I wanted to have a deeper look into the data and approaches I’d started with the Women Who Code workshop.

I wanted some compelling Twitter data, and given the year we’ve had so far in 2016, politics seemed a good choice. Between Australia’s federal election, the EU referendum in the UK and the US presidential primaries, there was a lot going on in this space. Twitter engagement was huge across all of these events.

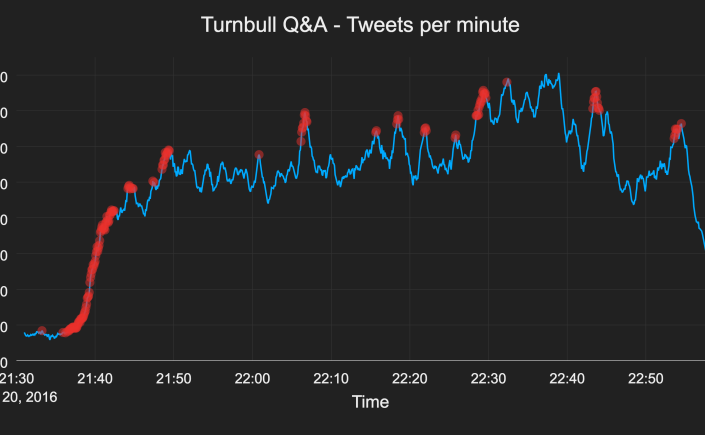
One thing I wanted to be able to do was to plot the rate of Twitter traffic in real-time. This was relatively easy with a couple of lines of Rx, and it gave me a good grasp of the tweets per minute rate through my data.

Continue reading

James Bond Data Analysis

This Bloomberg article on James Bond is pretty much perfect. These are some of my favourite things: data analysis, data visualization, and cheese.

I like that the authors sat through all Bond films to classify such things as:

  • Time spent flirting
  • Number of double entendres
  • Aggregate time spent in tuxedos – with (or the morning after adventurous nights) without jacket

I also like that the method of data gathering and delineation of time in/out of tuxedos (or shirts) is precisely specified. Accuracy is important in maintaining significance and respectability.

Also important is the attention to detail in Bond’s romantic escapades, and kudos must go to the authors for including “making eyes” in this category – an easily missed, but crucial and subtle part of any Bond film worth its salt.

Scoldings from M, Q and anyone else alphabetically named are all scientifically categorised. Gadgets are carefully distinguished from plain, unsophisticated weapons.

Poker, Baccarat, and a kaleidoscope of cocktails do not escape the authors’ scrutiny, and of most importance is recognition of Bond’s surname first self introductions.

What I like most of all of is the deep, rewarding insights the authors have uncovered:

  • Sean Connery spent the most time in top drawer dress, followed by Daniel Craig
  • Connery was also the most shirtless of all bonds (possibly a reason to stick to the newer ones)
  • Daniel Craig managed to find something other than romance to do for over 95% of his movies. It must be hard resisting the temptations of being so tempting.
  • The safest Bond to hook up with is Timothy Dalton, the only Bond to have no love interests perish during their movies. Of course, Timothy Dalton may not be the most appealing Bond to choose from, and so perhaps some of the others are worth the risk.
  • If you want an Aston Martin to stay in good shape, give it to me, not James Bond. Please.
  • Brosnan’s Bond was the most prolific with puns and double entendres. Perhaps if he was more focused on delivering value, his movies would have been more appealing.

Particularly worth attention, I think, is the in-depth analysis of correlation between flirting, love interest and mortality for Bond’s female companions. While most Bonds manage to endanger their love interests to the point of fatality in at least some of their movies, Craig, Connery and Moore all manage to lose two love interests in the same movie at least once.

I love the timelines of each movie, which reveal the typically short timeframe Bond takes to recover from the loss of a loved one before moving onto the next opportunity:

bondkey

bondromance.png

rogermooreromance

If only all scientific method was so exhaustive. Most recommended, A+++, would buy again.

Read the original article here.

Identifying Market Spoofing with Data Visualizations

I love data and data visualizations. They can give deep insight into problems and behaviours, and they can make you interested in something you previously thought dull.

I came across the article “How to Catch a Spoofer” from Bloomberg, by Matthew Leising, Mira Rojanasakul and Adam Pearce. The article gives a fascinating view into the trading activity on the Chicago futures exchange, and how to identify “spoofing” within trading activity. The visualizations take a combination of a difficult concept and large volume of data, and extract genuine, novel insights.

Continue reading

Roomba algorithms and visualization

I once had an interview question asking for an algorithm for a Roomba that ensures it covers every square of a room divided into grid cells, given that the room shape and location of obstacles are unknown. It’s similar to the idea of solving a maze, except that instead of getting to a specific point, you’re trying to visit every point in the room – to clean it!

It’s a pretty common problem, but I hadn’t seen it in the guise of a physical robot before. Running a Depth First Search covers every piece of floor easily enough, but casting it as a physical device that has to move implies a large cost to popping back up the stack that’s generated during DFS. There’s a lot of backtracking in a DFS based approach for a Roomba, so it makes for a slower vacuuming job.

It made me wonder whether there was some better approach than DFS that would be more efficient.

Continue reading