
I recently spoke at NDC Sydney, which was a great experience. My talk was on Real-Time Twitter Analysis with Reactive Extensions. I wanted to have a deeper look into the data and approaches I’d started with the Women Who Code workshop.
I wanted some compelling Twitter data, and given the year we’ve had so far in 2016, politics seemed a good choice. Between Australia’s federal election, the EU referendum in the UK and the US presidential primaries, there was a lot going on in this space. Twitter engagement was huge across all of these events.
One thing I wanted to be able to do was to plot the rate of Twitter traffic in real-time. This was relatively easy with a couple of lines of Rx, and it gave me a good grasp of the tweets per minute rate through my data.
Detecting traffic rates
Some of the data I was looking at was from the ABC’s Q&A show in Australia – in particular, two episodes where the two candidates for Prime Minister appeared in consecutive weeks as solo guests to make their case for election.
Here’s the tweets per minute graph for Prime Minister Malcolm Turnbull’s episode:

What I found interesting after plotting these streams out in real-time was the variability. There’s definitely a “normal” level of traffic around 500-600 tweets per minute here, but it’s in no way static or constant. There are lots of spikes, both large and small. This isn’t random noise, it’s the audience reacting to the changing discussion playing out in front of them.
Detecting spikes automatically
After seeing this I wanted my code to be able to detect these spikes in traffic. I wanted to have a stream of spike notifications over time, which would indicate points in the broadcast where the most contentious or hotly debated topics were being discussed.
This turned out to be a lot harder than I initially thought. It’s easy for a human eye to pick out the spikes in the above graph, but that’s because we can see the whole data set in retrospect. Identifying if the current point in time is a spike above normal is much harder than looking back over all the data in hindsight and picking out the peaks. I wanted the code to recognise, in the moment, that there was a spike in traffic happening.
I was getting the tweets per minute rate using 1 minute moving average windows, so I started by comparing this rate against tweet rates taken over longer windows of time. This is a fast vs slow moving average approach often used in finance, where the short duration window is focused more closely on the current point in time, while the longer window is representative of the recent norm.
An imperfect solution
But no matter the length of my comparison window, I was getting results where some peaks were missed, or some small, insignificant peaks were included. In other words, I was getting false negatives and false positives.
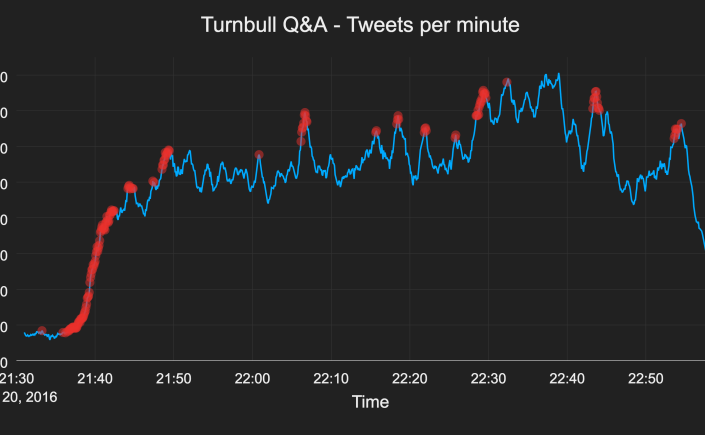
Looking at the Malcolm Turnbull episode, this is what I ended up with:

This is fairly good – it’s avoid most of the small spikes and kept most of the large ones. But there’s a big spike around 22:38 that it’s missing. The reason is that by the time that spike happens, the traffic has been so elevated for so long that it looks normal. The traffic around 22:38 doesn’t look significantly high enough above the traffic over the last few minutes to register as a spike.
This turned out to be one of the dead ends I spent a lot of time wandering down during my talk. I was convinced there must be a way to improve the approach, to improve the hit ratio of detected spikes. Eventually I got frustrated enough to figure there must be someone out there smarter than me (very likely) who has already solved this (also likely). After a thorough Google I found that in fact it’s an unsolved (or possibly unsolvable) problem.
A difficult problem
There are three angles of tension here:
- Avoiding missing large spikes
- Not reporting small fluctuations as spikes
- Reporting spikes as early as possible
It turns out that when looking at real-time data, there’s simply no way to optimise all three of these points. You can report all large spikes, and report them early, but you’ll pick up small fluctuations in the process. Or you can avoid small fluctuations, at the cost of missing some larger spikes. Or you can keep most large spikes, avoid fluctuations, but only by waiting a long time to see the full scale of the spike play out, by which time it’s already over.
During my searches, I found many interesting articles:
- Simple algorithm for online outlier detection of a generic time series
- Peak signal detection in realtime timeseries data
- How to detect significant change trend in a time series data
- Wikipedia articles on adaptive filters and least mean square filters
- and several references to the fact that solving this well was not easy
The clincher was finding this gem in the Wikipedia article on change detection:
Using the sequential analysis (“online”) approach, any change test must make a trade-off between these common metrics:
- False alarm rate
- Misdetection rate
- Detection delay
If it’s on Wikipedia, it must be true. It became clear that my problem was a common one, and a very general one. It’s similar to problems in the audio space, and to detecting sudden changes in light levels from an imperfect light sensor in variable lighting conditions.
A few things became clear:
- Making the algorithm real-time or online is the challenge – it’s easy if you have all the data up front
- The simple approach was the one I was already doing
- Smoothing out spike signals and reducing false positives is in opposition to reducing spike detection latency
- Better solutions are far more complex and require far more stats knowledge than I have
- And they’re still imperfect
Final solution
Faced with not being able to easily achieve what I wanted, I went with the layman’s plan B – lowering expectations. The aim of this work is to identify moments when the audience engagement suddenly jumps or drops. Latency on those signals reduces their value, so I erred towards higher noise and lower latency.
This is the approach I settled on:
- Compare the number of tweets in the last minute
- Against the average tweets per minute of the previous 2 minutes before that
- Flag where the recent activity differs from the previous activity by more than 15%
In simplified form, the code boiled down to:
let current = tweets.windowWithTime(60000);
let normal = tweets.windowWithTime(120000).delay(60000);

current.withLatestFrom(normal, getDifferenceAsPercentage)
       .filter(diff => diff > 0.15)
       .subscribe(...)
Aren’t customised thresholds and window lengths cheating?
One person at my talk pointed out that is’s all well and good to come up with this approach after having had the data to explore and hone the thresholds on, but it’s very different to write code that can do this with new data in real-time.
That’s very true. In fact, if the data is totally new to your program, it’s impossible to do this perfectly in real-time. Not difficult, impossible. Any approach to real-time spike detection will need some previous heuristics about the expected behaviour of the data.
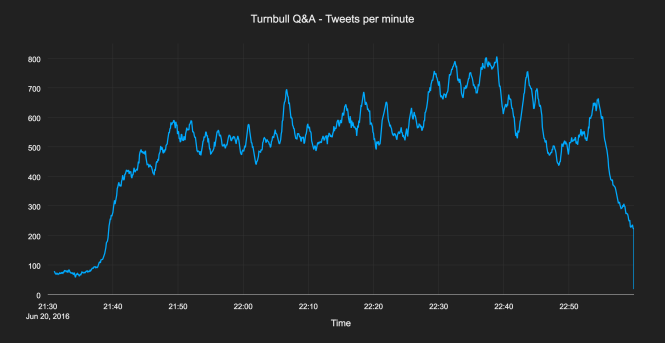
Consider this graph. At the start of the data, we’re getting around 80 tweets per minute. As far as the code knows, this is “normal”, and the early rise to 100 tweets per minute would seem significant – a 25% increase in traffic. But then the live Q&A broadcast on the ABC begins and the rate jumps up to 500 tweets per minute – an increase of over 500%.
Suddenly that earlier 25% increase doesn’t look so significant any more. But later in the broadcast, there’s a sudden increase of just over 30%, starting around 560 tweets per minute. How is the code supposed to know that the first jump of 25% is unimportant, but the later spike of 30% is definitely noteworthy? With the hindsight we get from looking at the plot of the whole episode, it’s easy to make that judgement, but to be able to recognise it in real-time is not so simple.
In order to hone spike detection the code needs an idea of the expected behaviour of the stream, so that it can know what level of spike is significant or not. This understanding comes from observing a lot of data – either by the developer or the code itself. Either way you first have to get a feel for the data before you can define what “normal” and “abnormal” look like. Without this knowledge the code could be missing important spikes, or reporting irrelevant ones.
The approach I came up with works fairly well for the data I have. A different source or type of data would behave differently. Consider Twitter traffic during a soccer match. This will spike massively in the moments where there is a goal, or a contentious penalty, etc. If we’re trying to pick out these major moments in the match, the 15% threshold I used for the Q&A traffic will probably be too low. I wouldn’t be surprised if traffic more than doubled after a goal is scored.
End results
Despite the imperfections of this approach, it still worked fairly well. Identifying the spikes in the traffic was the basis for a more in-depth piece of analysis that looked at identifying the topics that were drivers for the high points in the online conversation. More on that in a later post…

[…] discussed spike detection in a previous post. Finding the topics during spikes is just a matter of sampling the latest value of discussion […]
LikeLike
[…] Detecting spikes in real-time data […]
LikeLike